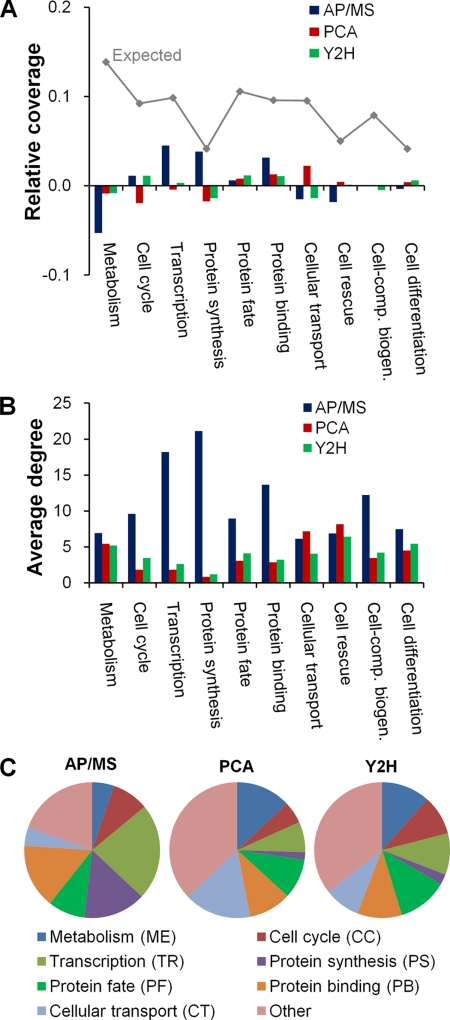
Fig. 1.
Functional diversity among proteins and interactions present in the high-confidence data sets. A, The relative distribution of all proteins from Saccharomyces cerevisiae, as annotated according to the Munich Information Center for Protein Sequences functional categories, is shown by the gray line labeled “Expected.” It denotes the relative fraction (coverage) of all yeast proteins that belong to a given category. The deviations of the AP/MS, PCA, and Y2H high-confidence data sets from this distribution are shown by the different colored bars, e.g. proteins labeled “Metabolism” are relatively under-represented in the AP/MS data set. B, The average degree of the proteins in a given functional category for each high-confidence data set. C, The relative distribution of protein-protein interactions in the different functional categories for each high-confidence data set.

