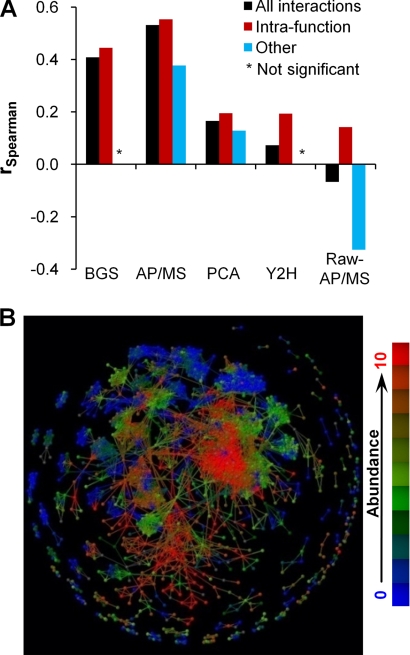
Fig. 7.
Protein abundance correlation between interacting protein pairs. A, Spearman rank-correlation coefficients rSpearman between abundance ranks of interacting proteins. The histograms are shown for all interactions (All interactions), the subset that encompasses interactions that share the same intrafunction annotations (Intrafunction), and all remaining ones that do not (Other). We indicated correlations that were not statistically significant by a star (*). B, Abundance map of the AP/MS data set. Abundance values (50) were divided into 11 classes from 0 (smallest) to 10 (largest), and each class was represented by a color. Class 0 is the collection of proteins whose abundances were too small to be detected, and classes 1–10 were equally divided among proteins whose abundance could be detected. Interacting proteins in each visible cluster tended to have the same abundance values.

