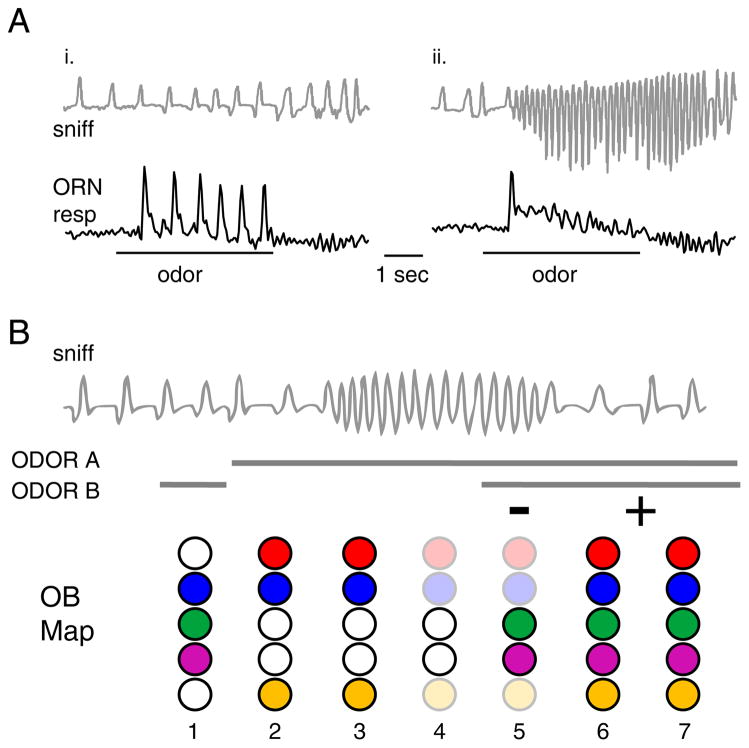
Figure 4. Adaptive filtering of sensory inputs controlled by sniffing.
A. Rapid attenuation of receptor neuron activation during sustained high-frequency sniffing of an odorant. Top traces show sniffing in a head-fixed rat, lower traces show ORN responses (estimated from presynaptic calcium signals using temporal deconvolution). Responses are reliable across inhalations when sampled at low frequency (left), but attenuate rapidly during high-frequency sniffing of the same odorant. Modified with permission from (Verhagen et al., 2007).
B. Schematic illustrating effects of high-frequency sniffing on odor representations in a changing odor landscape. Top, representative sniffing pattern including a bout of high-frequency sniffing. Solid lines indicate preence of odorA, odor B or both A and B. Lower graphics (‘OB map’) represent patterns of activation across five glomeruli in the olfactory bulb at different times during the sniff bout. When sampled in isolation, A and B have overlapping representations (1 – 2). High-frequency sniffing of odor A causes an attenuation of the response map (3 – 4); when odor B is encountered against the background of odor A, only those glomeruli that differ from those activated by odor A are strongly activated, so that the representation resembles the difference between the two odor maps (5). A return to low-frequency sniffing removes the attenuation and the representation changes to resemble the sum of the two maps (6 – 7). Thus, changes in the odor landscape are represented in a subtractive or additive mode depending on sniff frequency.

