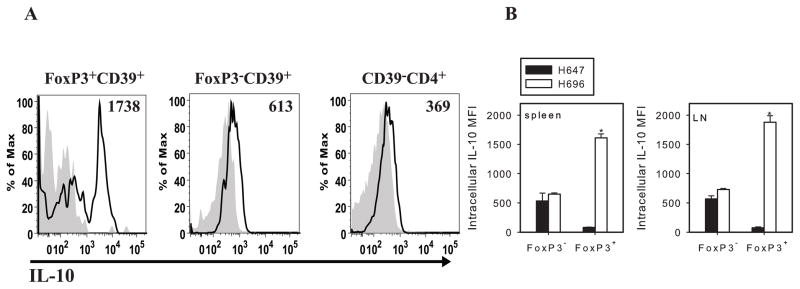
FIGURE 6.
FoxP3+CD39+CD4+ T cells express IL-10. A, Representative histogram of IL-10 expression by Salmonella-CFA/I-induced FoxP3+CD39+, FoxP3− CD39+, and CD39−CD4+ T cells; gray histographs depict isotype control Ab. B, IL-10-specific MFI corresponding to FoxP3− and FoxP3+ subsets of CD39+CD4+ T cells in spleens and combined MLNs and LNs are depicted; *p < 0.001; **p < 0.05.

