Fig. 6.
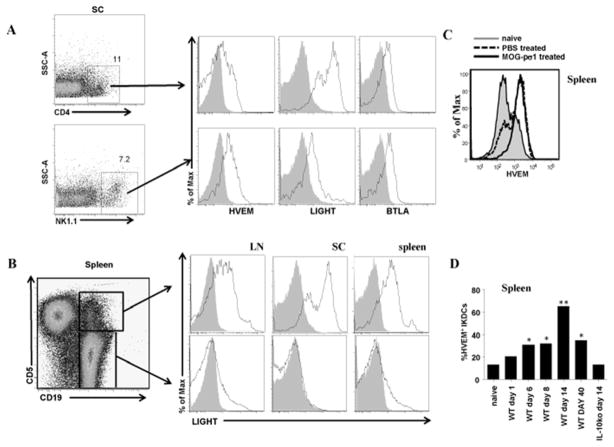
MOG-pσ1 treatment induces an up-regulation of HVEM in NK1.1+ cells. A. C57BL/6 mice were treated with MOG-pσ1 or PBS 20 days after EAE induction, and 24 h after treatment, spleens and SC cells were stained for CD4, NK1.1, HVEM, LIGHT, and BTLA. Percentages of infiltrating CD4+ T cells and IKDCs in the SC of PBS- or MOG-pσ1-treated mice are shown. Staining by an isotype control mAb is shown as filled histogram; * P ≤ 05. A representative experiment of three is depicted. B. EAE was induced in C57BL/6 mice, and 20 days later, splenic, LN, and SC lymphocytes were purified and analyzed by flow cytometry for CD5, CD19, HVEM, LIGHT, and BTLA expression. Gating strategy is shown on the left-hand side. Histograms and percentages of positive cells are shown on at the right-hand side. Staining by an isotype control mAb is shown as filled histogram. A representative mouse out of five is shown. C. A histogram depicts HVEM levels for splenic NK1.1+ cells from naïve and PBS- or MOG-pσ1-treated EAE mice. A representative experiment of three is shown. D. Percentages of splenic CD11c+NK1.1+ IKDCs expressing HVEM at different time points after EAE induction are shown. Percentages of HVEM+ IKDCs from IL-10−/− mice at day 14 after EAE induction are also shown. *P < 0.05, **P ≤ 0.01 versus naive mice.

