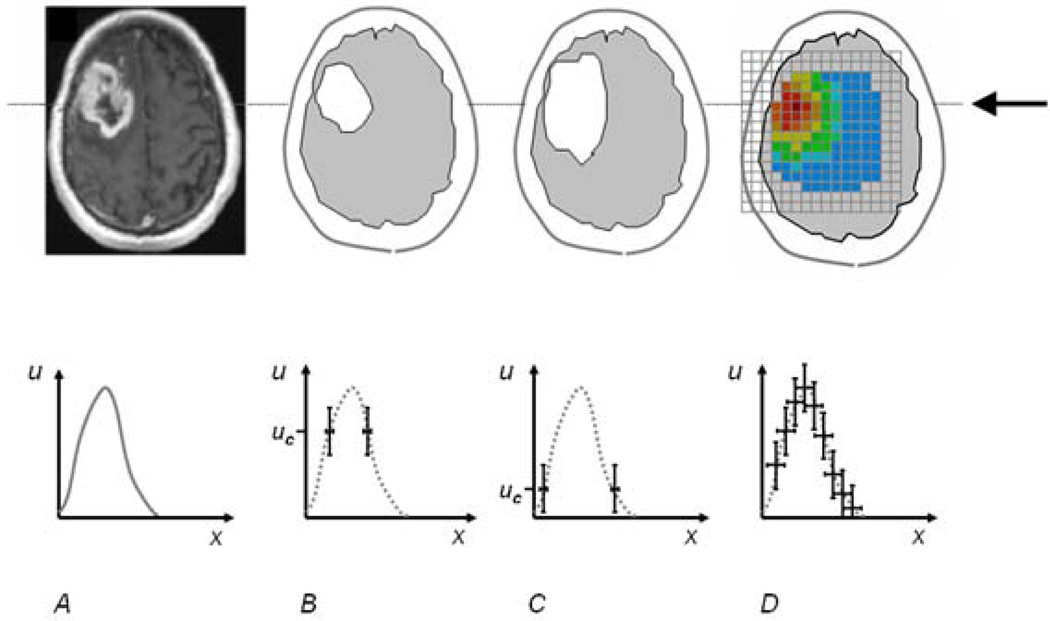
Fig. 2.
Example relationships between image information y (top) and tumor cell density u (bottom). A: actual T1gad image and the schematic tumor cell distributions along the line indicated by the arrow in the top row. B, C: exemplary modalities where only the visible tumor segmentation ys can be correlated with specific values uc of the state variable u. D: exemplary modality where all entries of the functional map ym can be correlated with the latent state variable u.

