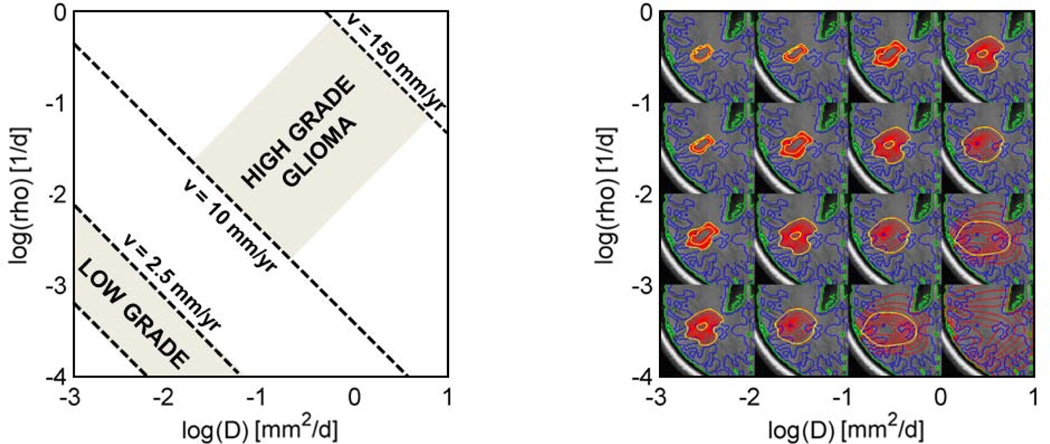
Fig. 3.
Parameter space of the tumor model with tumor cell diffusivity D and proliferation rate ρ. Left: Parameterization for high- and low-grade glioma [1,22]. The speed of growth υ can be obtained from times series of images [16]. It provides complementary information to tumor shape. Right: Shapes of equally large tumors for different parameterizations. Isolines of u = .05 and u = .6 are shown in yellow. We use the information from both time series and tumor shape jointly to characterize infiltrative and proliferative behavior of the tumor.

