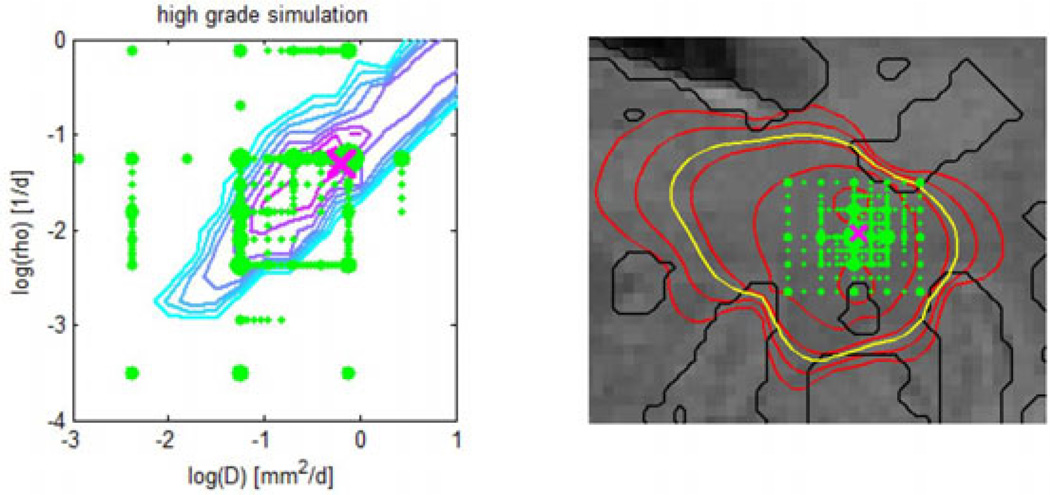
Fig. 4.
Adaptive sampling of the parameter space for the synthetic high-grade data set. Left: Sampling points (green) for the model parameters θp = {D, ρ}. The contour map shows the posterior distribution p(θp|Y) evaluated on a regular grid (cyan–low, pink–high). Right: Sampling points (green) for the {x, y} coordinates of the tumor seed θx. The Fig. also shows isolines of tumor cell density (red), the predicted extensions of the T2 hyper-intense area (yellow) and tissue boundaries (black). In both figures the size of the green sampling points indicates how often the indicated parameter was evaluated under different combinations. The ground truth is indicated by the pink cross. Most adaptively chosen sampling points are close to the ground truth.

