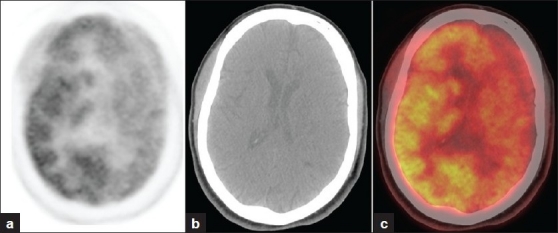
Figure 2.

Transaxial sections at basal ganglia level (a) PET (b) CT (c) fused PET/CT showing FDG hypometabolism in the frontal, parietal and temporal cortices and basal ganglia on the left side region corresponding to a well defined hypodense area on CT
