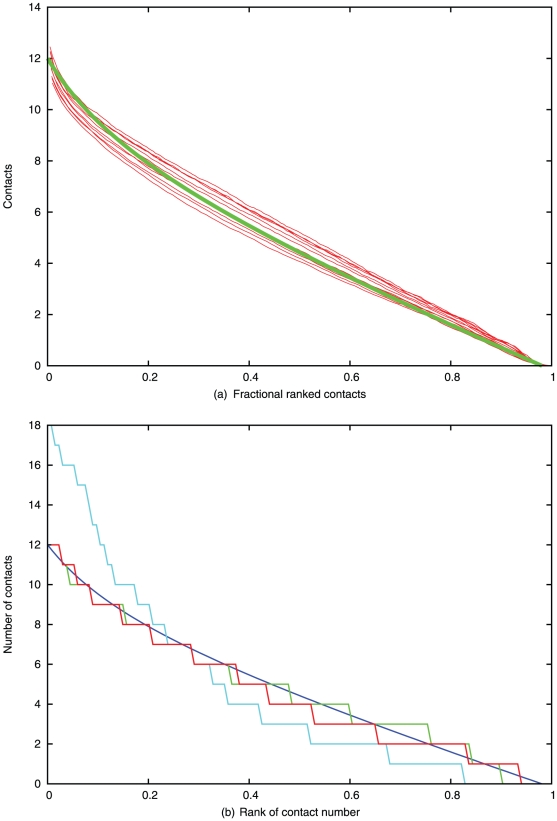
Figure 2. Number of contacts per residue.
(a) The number of pseudo-centroid contacts is plotted against the fractional rank of the residues in the protein where 0 is most dense and 1 least dense. The red lines each represent data from the SCOP40 database in ten length bins spanning 100 to 200 residues. The green line is a fitted curve (described in the text). (b) Predicted contacts for 1f4p before correction (cyan) and after correction (red) are plotted along with the observed contacts (green) and the theoretical curve from part a (blue).

