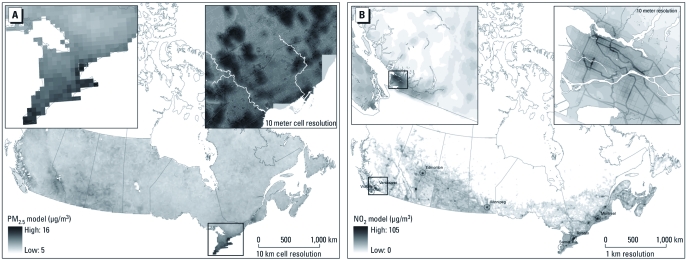
Figure 2.
National annual average models for PM2.5, highlighting southern Ontario and the city of Toronto (A), and for NO2, highlighting southwestern British Columbia and the city of Vancouver (B), that incorporate satellite-derived pollutant estimates, geographic land use variables, and deterministic gradients. The seven cities shown in (B) represent locations of independent monitoring data used to evaluate the national NO2 and benzene models.

