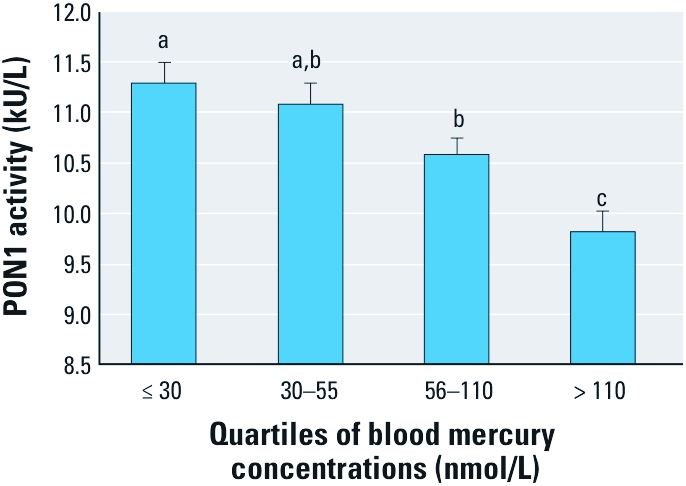
Figure 2.

Relation between blood mercury concentrations and PON1 activity in Inuit adults from Nunavik. Each bar represents the geometric mean ± 95% confidence interval. Mean values were adjusted for age, blood selenium levels, plasma HDL-C concentrations, and PON1 genotypes (rs662, rs854560, rs705379). Different letters above the bars indicate mean values that are significantly different from one another.
