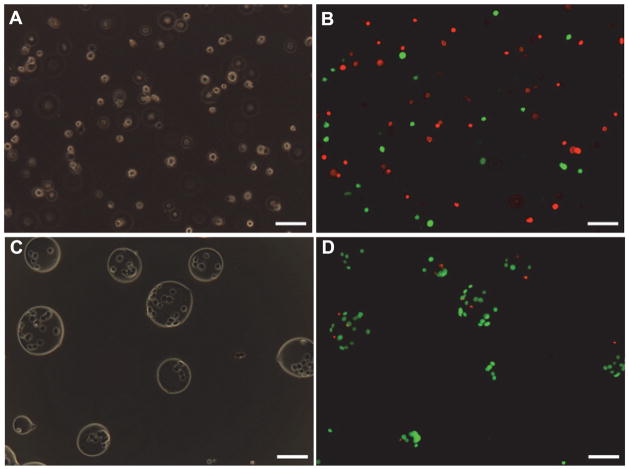
Figure 2.
Phase contrast (A and C) and fluorescence micrographs (B and D) of non-encapsulated (A and B) and encapsulated (C and D) cells after cryopreservation by vitrification. In the fluorescence micrographs (B and D), live and dead cells were stained green and red, respectively. The cell viability were high (> 95%) for both encapsulated and non-encapsulated cells before cryopreservation. Scale bars: 100 μm. Figure reprinted and redrawn from reference [134] with permission from Springer Publishing Co.

