Figure 1.
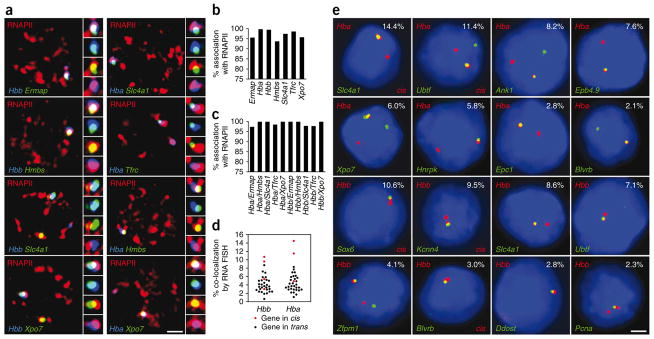
Genes interchromosomally co-associate in transcription factories. (a) Triple-label RNA immuno-FISH of gene pairs and RNAPII factories. RNAPII-S5P staining is in red and RNA FISH signals are in green and blue, as indicated, for each gene pair. Side panels show enlarged images of the colocalizing FISH signals (top to bottom: triple label, blue and green, red and green, red and blue). Scale bar, 2 μm. (b,c) Bar charts showing percentages of RNA FISH signals that associate with an RNAPII factory (b) and percentages of colocalizing RNA FISH signals that co-associate within the same RNAPII focus (c). (d) Scatter plot showing distributions of RNA FISH colocalization frequencies for genes in cis (red) and trans (black) with Hba and Hbb. (e) Representative double-label RNA FISH in definitive erythroid cells for several erythroid-expressed genes (green) and Hba or Hbb (red), as indicated, with DAPI staining in blue. Colocalization frequencies are shown on each panel, and co-associations in cis are labeled. Scale bar, 2 μm.

