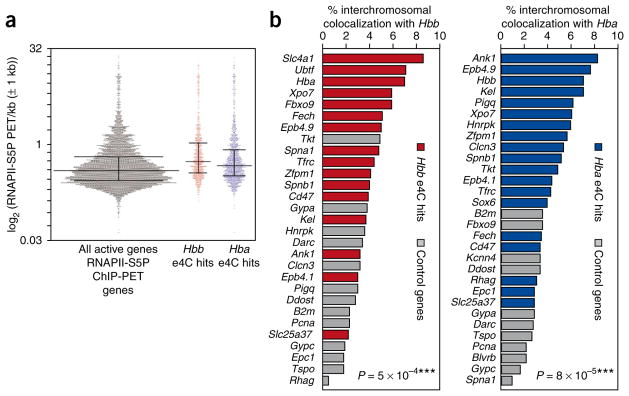
Figure 4.
Validation of the e4C assay. (a) Scatter plot showing distributions of all erythroid-expressed genes (gray dots), Hbb e4C hits (red) and Hba e4C hits (blue), ranked by RNAPII-S5P PET density. Horizontal lines represent the median, 25th and 75th percentiles. (b) Validation of e4C by interchromosomal RNA FISH colocalization frequencies with Hba and Hbb. Genes identified by e4C as associating with Hba are highlighted in blue, Hbb e4C–associating genes are in red and non-hit genes in gray. P values are for differences in colocalization frequencies between e4C hit and non-hit genes.

