Figure 7.
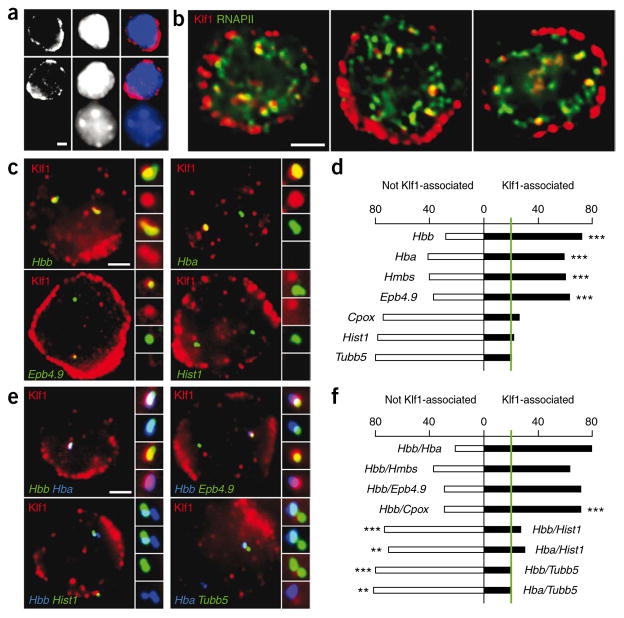
Co-regulated genes cluster in specialized transcription factories. (a) Immunofluorescence staining for Klf1 in definitive erythroid cells. Klf1 is shown in red, DAPI in blue. Note nonerythroid, Klf1-negative cell (bottom) demonstrating antibody specificity. Scale bar, 2 μm. (b) Immunofluorescence detection of Klf1 (red) and RNAPII-S5P (green) in definitive erythroid cells. Scale bar, 2 μm. (c) Double-label RNA immuno-FISH of nascent transcripts (green) and Klf1 foci (red). Side panels show enlarged images of selected nascent transcript signals with corresponding red channel (Klf1). Scale bar, 2 μm. (d) Graph showing proportions of RNA FISH signals found associated with Klf1 foci (black), or not associated with Klf1 foci (white). Green line shows ‘background’ association level of 20%, based on proportions of transcription factories containing high levels of Klf1. Indicators of P values are shown for Klf1 association frequencies higher than the background level (***P < 0.001). (e) Triple-label RNA immuno-FISH for pairs of nascent transcripts (blue and green, as indicated) and Klf1 foci (red). Side panels show enlarged images of the colocalizing FISH signals (top to bottom: triple label, blue and green, red and green, red and blue). Scale bar, 2 μm. (f) Graph showing proportions of colocalized pairs of RNA FISH signals found associated with Klf1 foci (black) or not associated with Klf1 foci (white). Green line shows ‘background’ association level of 20%, based on proportions of transcription factories containing high levels of Klf1. Indicators of P values are shown for increase in Hbb-Cpox Klf1 association frequency compared with Cpox Klf1 association frequency, and for decreases in globin-Hist1h3f Klf1 and globin-Tubb5 Klf1 association frequencies compared to globin Klf1 association frequencies (**P < 0.005; ***P < 0.001).

