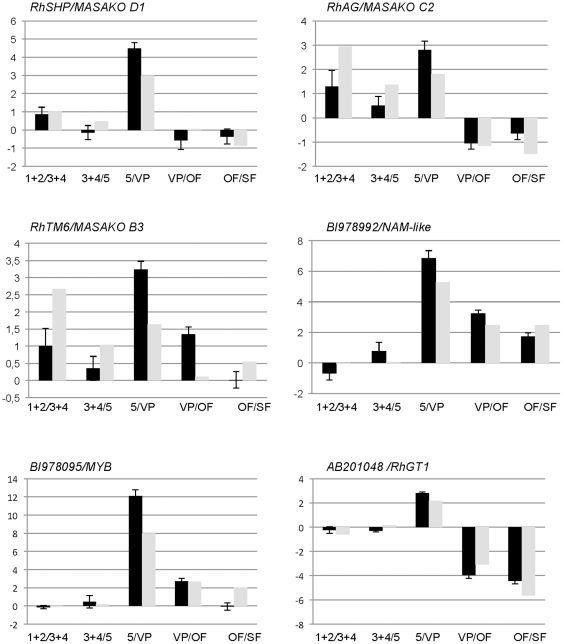
Figure 3. Real time quantitative RT-PCR (qPCR) analysis of six selected differentially expressed genes during rose floral organogenesis, floral opening and senescence in R. chinensis cv. Old Blush.
qPCR data (black histograms) are compared to the microarray hybridization data (white histograms). Microarray data is presented regardless of Bonferroni test success. Each pair of histograms represent successive comparisons between floral development stages 1+2, 3+4, 5, visible petals (VP), open flower (OF) and senescing flowers (SF).

