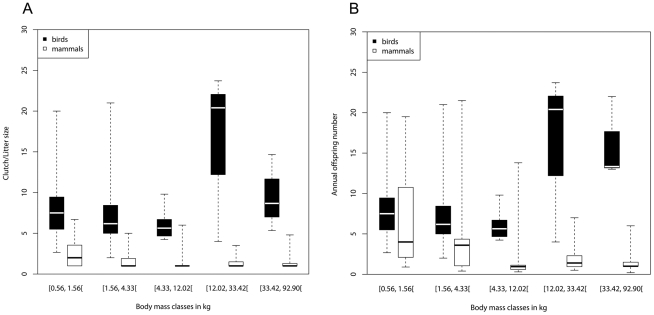
Figure 2. Comparison of the potential reproductive output of birds and mammals for different weight classes.
Potential reproductive output is measured as medians of clutch/litter sizes (A) and medians of annual offspring number (B) for species groups of different weight classes. Each weight class interval has a width of 0.444 (unit is kg) on a logarithmic scale. Birds of all weight classes had a higher median clutch/litter size than similar-sized mammals. Similar-sized birds had on average (median) more offspring per year than mammals in all weight classes. For the detailed results of the statistical analyses, refer to the text. Box plots show medians, quartiles, minima and maxima of clutch sizes and litter sizes.

