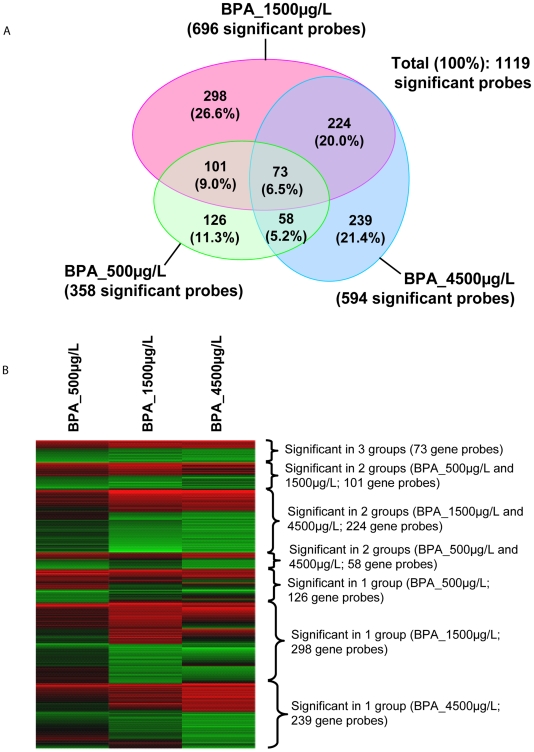
Figure 3. Transcriptomic changes induced by BPA early-life exposure toxicity.
(A) Venn-diagrams showing number (percentage) of genes that were considered significantly deregulated among the three treatment groups (BPA_500 µg/L, BPA_1500 µg/L and BPA_4500 µg/L). B) Expression profiles of gene probes categorized based on their significant deregulation in one, two and three treatment groups. The colored cells reflect the mean expression level of four biological replicates in each concentration group when compared to the control (vehicle) group (n = 4). Shades of red cells reflect up-regulated, green cells reflect down-regulated and black cells reflect unchanged, expression levels when compared to control (vehicle) group.

