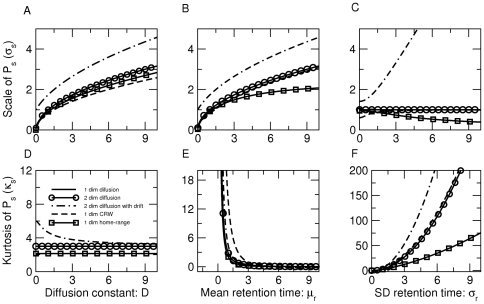
Figure 3. Scale and kurtosis of  for four different patterns of animal movement.
Top row of the panel shows scale as a function of the diffusion constant in (A), mean seed retention time in (B), and standard deviation (SD) in seed retention time in (C). In (C) we also demonstrate that in the model with drift, scale increases with SD in retention time and thus differs notably from other movement models. Bottom row (D)–(F) shows kurtosis as a function of the same parameters. Although the qualitative features of kurtosis remain the same across different movement models, it is always larger for the model with drift. For 2 dimensional models, we have plotted scale and kurtosis along one dimension. Parameters for (A) and (D):  ; for (B) and (E):
  ; for (C) and (F):
  . See Table 1 for a description of parameters.

