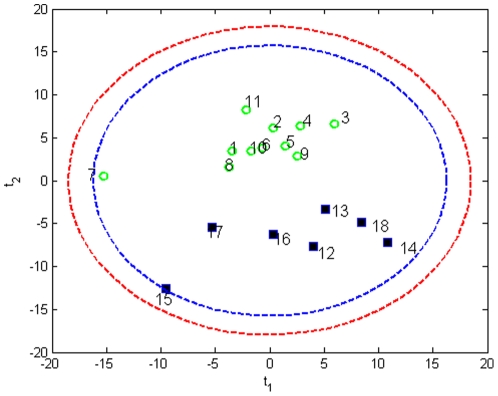
Figure 3. Score bi-plot of all liver samples measured, with 95% and 99% confidence limits.
Fresh liver sample 7 and warm ischemic liver sample 15 fall away from the two clusters representing fresh livers and warm ischemic livers. (1–11 fresh samples denoted by green circles, 12–18 warm ischemic samples denoted by squares).

