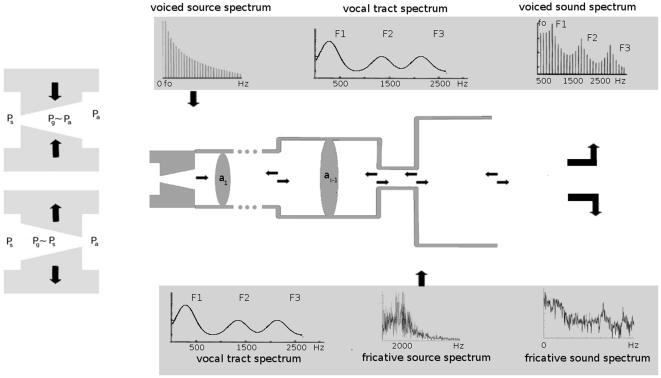
Figure 1. Sketch of the vocal model.
The figure in the middle represents the concatenation of tubes that approximate the vocal tract. The upper panel represents, from left to right, the voiced source spectrum of fundamental frequency  , the vocal tract transfer function for a tube of about 17.5 cm and the multiplication of both, corresponding to the resulting voiced sound. In the lower panel, a colored noise sound source characterizing the turbulent flow at the exit of the constriction at the section
  of the vocal tract and the resulting fricative sound, filtered by the vocal tract.

