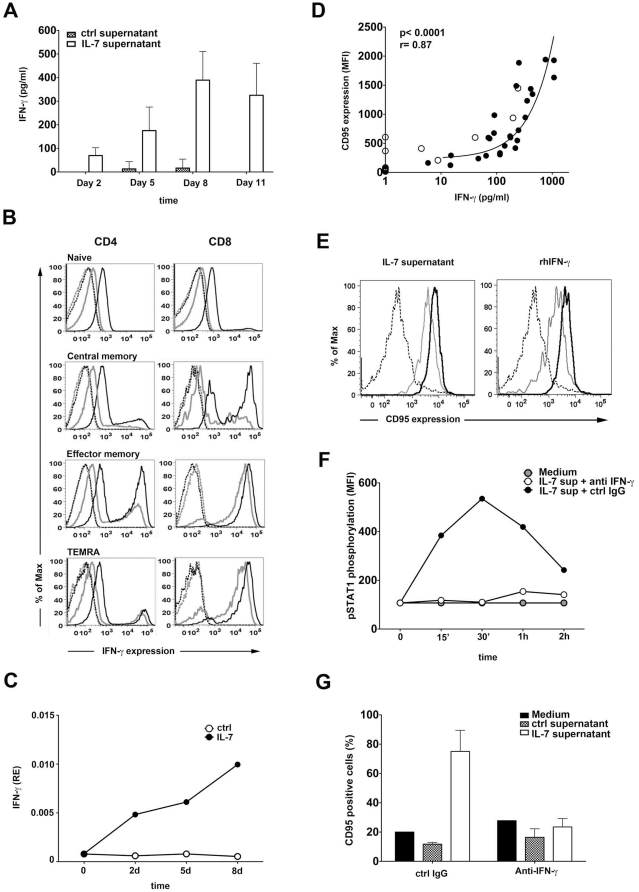
Figure 4. IL-7 induces CD95 upregulation on B cells via IFN-γ released from T cells.
A. Purified T cells were cultured in the presence or absence of 25 ng/ml IL-7 and IFN-γ concentrations were measured at the indicated time points using ELISA. Mean values and standard deviations are calculated from the results of 7 independent experiments. B. IFN-γ expression was analyzed by flow cytometry in naïve (CD45RA+CCR7+), central memory (CD45RA-CCR7+), effector memory (CD45RA-CCR7−) and TEMRA (CD45RA+CCR7−) T cell subsets cultured in the presence (black line) or absence (grey line) of 25 ng/ml IL-7 for five days. Dashed lines represent isotype control staining. Data are representative of 3 independent experiments. C. IFN-γ mRNA levels were measured in IL-7 treated or untreated T cells by real time PCR. D. IFN-γ concentrations measured in the IL-7 treated or non-treated T cell supernatants are correlated with the ability of the same supernatants to induce CD95 expression on B cells (using the samples described in panel A). Black dots represent IL-7 treated, white dots represent non treated T cell supernatants collected at day 2, 5, 8 or 11. E. CD95 expression is shown on freshly isolated B cells (dashed line) or following a 12 h (grey lines) or 48 h (black lines) treatment with IL-7 treated T cell supernatants or 20 ng/ml recombinant human IFN-γ. F. STAT-1 phosphorylation is measured using flow cytometry in sorted B cells treated with supernatants of IL-7 treated T cells in combination with 10 mg/ml neutralizing anti-IFN-γ or isotype control antibodies. Data are representative of 3 experiments. G. B lymphocytes were cultured for five days with IL-7 treated or non treated T cell supernatants or were left untreated in the presence of 10 mg/ml neutralizing anti-IFN-γ or isotype control Abs. Thereafter the expression of CD95 was analyzed by flow cytometry. Data are representative of 3 different experiments.

