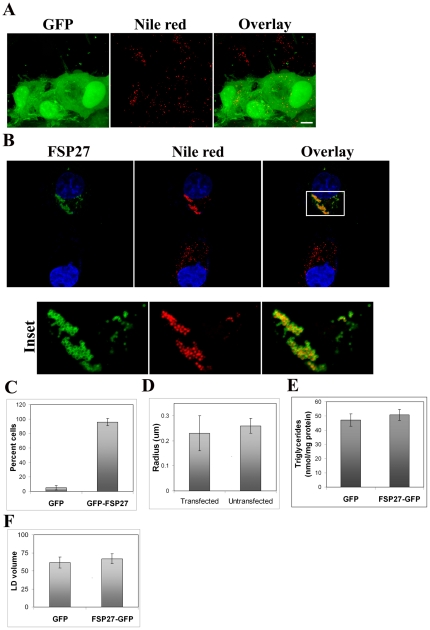
Figure 1. FSP27-GFP expression causes clustering of LDs in COS-7 cells.
A, COS-7 cells were transfected with GFP vector alone. Left panel shows GFP expression in cells after 16 hr of transfection. The LDs stained with Nile red are shown in red color in the middle panel. Bar, 10 µm. B, COS-7 cells transfected with FSP27-GFP for 16 hr. Nucleus was stained with DAPI. Left panel shows cell expressing FSP27-GFP (top) and non-expressing cell (bottom) in the same fied of the microscope. The middle panel shows LDs stained with Nile red. A 2 µm Z-slice of the transfected cell (in the inset of top right panel) is enlarged in the lower panels to show a clear representation of FSS7-GFP distribution around the clustered droplets (also see Figure S1). Bar, 10 µm. C, percent of GFP or FSP27-GFP expressing COS-7 cells which showed clustered LDs. Results are an average of at least three independent experiments ± standard deviation. About 25 cells were counted in each individual experiment (p<0.0001). D, morphometric analysis was performed to measure the radius of LDs in FSP27-GFP transfected and untransfected COS-7 cells. Results are an average of at least 25 cells from three independent experiments ± standard deviation. E, Biochemical quantification of total triglycerides in COS-7 cells after 16 hr of transfection with GFP and FSP27-GFP cDNA. Data is from three independent experiments, error bars show standard deviations (p = 0.17). F, total LD volume in cells transfected with GFP vector alone and FSP27-GFP. The bars indicate the volume in µm3 ± standard error, (*, p = 0.3).

