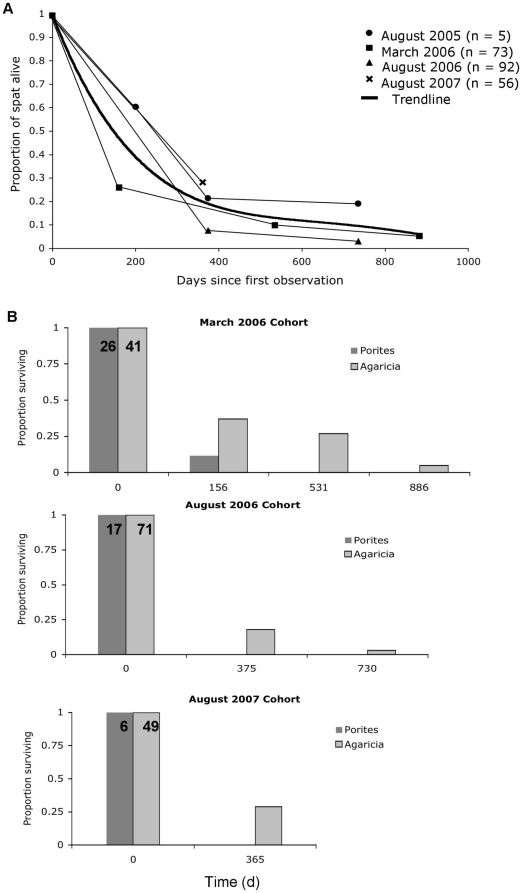
Figure 7. Survivorship curves by cohort and species.
A Proportion of spat alive at each subsequent monitoring period. A fourth-order polynomial curve fits all cohorts (in bold), highlighting an average survivorship of ∼20% after 365 d and overall mortality converging to >90% by the end of the study. B Survival of three cohorts of Porites spp. and Agaricia spp. over time.

