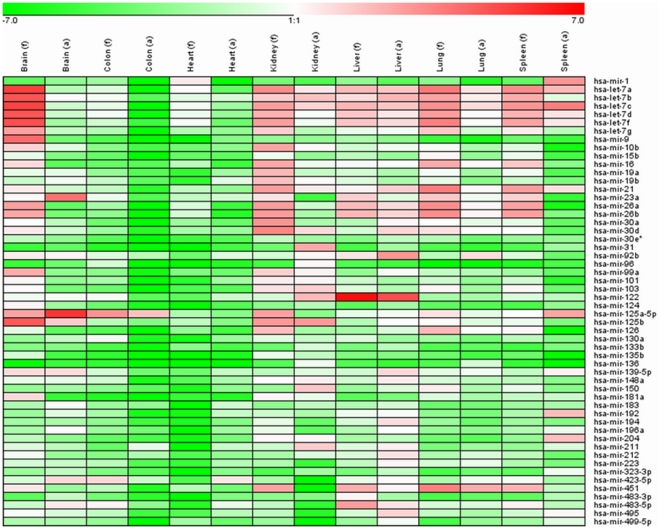
Figure 1. Expression profiles of 54 mature miRNAs in the 7 matched organ samples.
Samples and miRNAs are displayed in rows and columns, respectively. The relative expression values ranged from +7 log2 to −7 log2, which are exhibited with different colors. The bright red colors represent the highest expression levels, the light green colors represent the lowest expression levels. f, foetal; a, adult.

