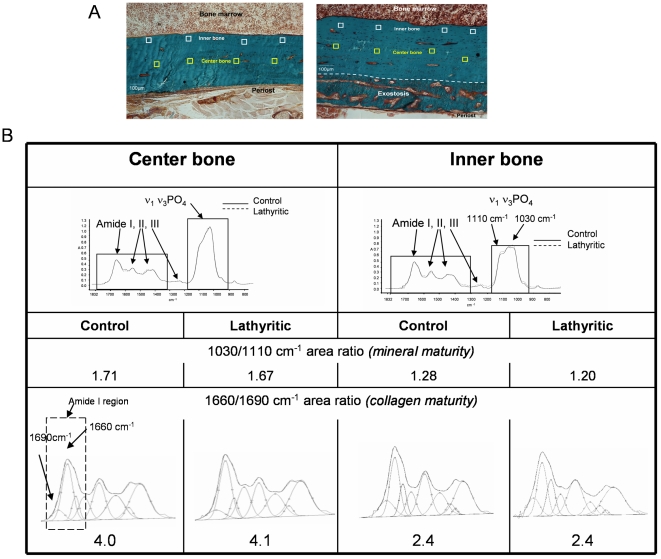
Figure 3. FTIRM analysis.
A. Sections of bone (radii) from control (left) and lathyritic (right) rat, stained with Trichrome Goldner. □: zones of measurements (35×35 µm) performed by infrared microspectrocopy either in inner bone (near bone marrow) in white, or in central bone in yellow (10 measurements in each cortical, 4 shown). The dash line indicates the exostosis in lathyritic bone, in lateral part of bone. B. Infrared spectra of center and inner bone in control and lathyritic bones, with curve fitting of amide I and ν1ν3PO4 vibrations. For a given mineral maturity (1030/1110 cm−1 area ratio), there was no difference in the collagen maturity (1660/1690 cm−1) between control and lathyritic bones. However, collagen maturity and mineral maturity area ratios were higher in the center bone compared to the inner bone in both control and lathyritic bones.

