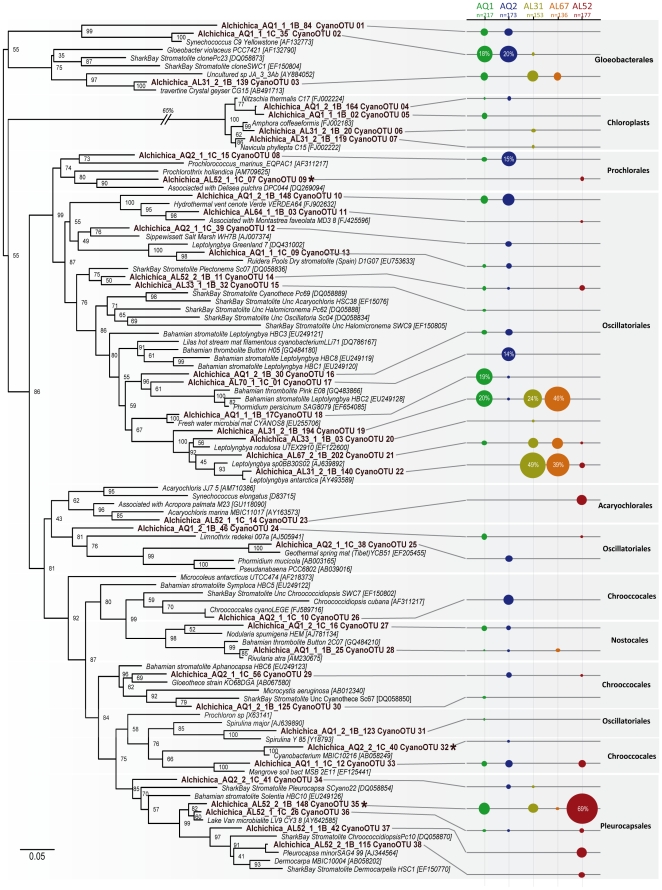
Figure 4. Maximum likelihood (ML) phylogenetic tree of SSU rDNA of cyanobacteria and chloroplasts from Alchichica microbialites.
Numbers at nodes indicate bootstrap values. Sequences from this study are in bold. Relative proportions of the different OTUs in each sample are indicated by circles of proportional size on the right. The number (n) indicates the number total of clones analyzed for each sample. Asterisks indicate OTUs also identified in DGGE patterns. The scale bar indicates the number of substitutions per site for a unit branch length.

