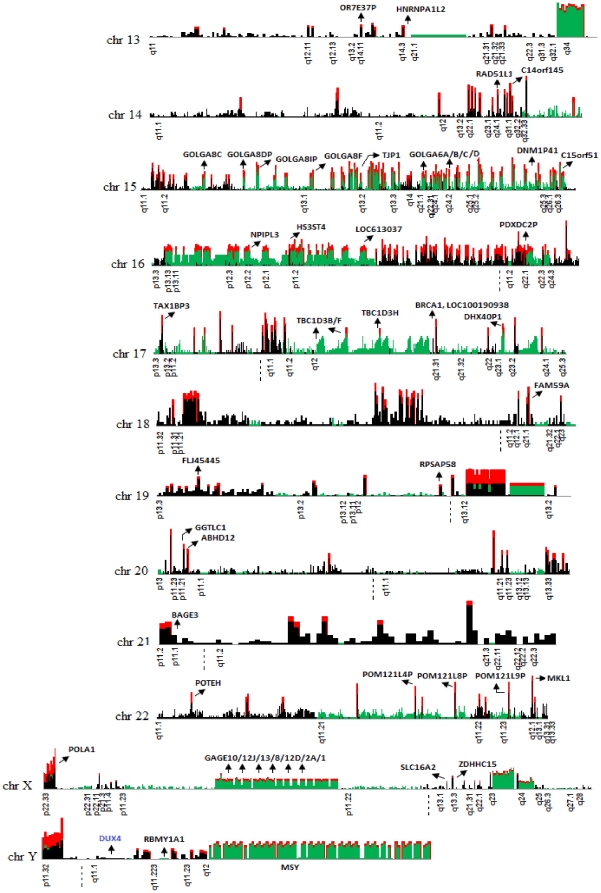
Figure 4. Landscape of chromosomal rearrangements in the NA18507 human genome.
Chromosomal rearrangements located within duplicated regions are plotted against the human genome. Green bars represent the signature of intra-chromosomal rearrangements, black bars represent inter-chromosomal rearrangements and red bars represent ‘rearrangement hotspots’. Cytobands with duplications for each chromosome and selected genes that completely or partially overlapped with SD units are also indicated.

