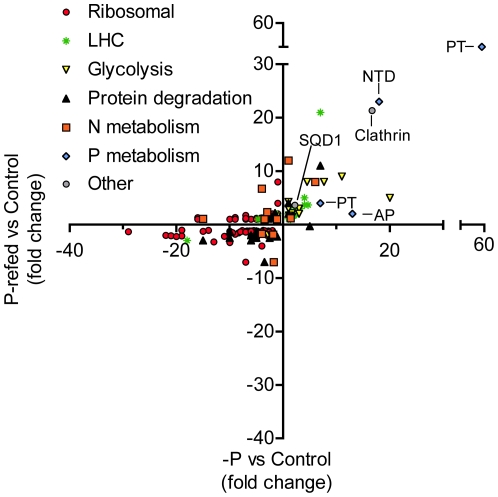
Figure 2. Abundances of specific categories of proteins.
Scatter plot highlighting those proteins that fell into the categories of being putatively related to ribosomal, light harvesting complex-like (LHC), glycolysis, protein degradation, N-metabolism, P-metabolism, or other (e.g. clathrin). For those proteins involved in putative P-metabolism, specific proteins are highlighted and include: PT: Inorganic phosphate transporter, SQD1: Sulfolipid biosynthesis gene, NTD: 5′-nucleotidase, AP: Alkaline phosphatase. Clathrin is also noted. Fold-changes were calculated relative to the control treatment.

