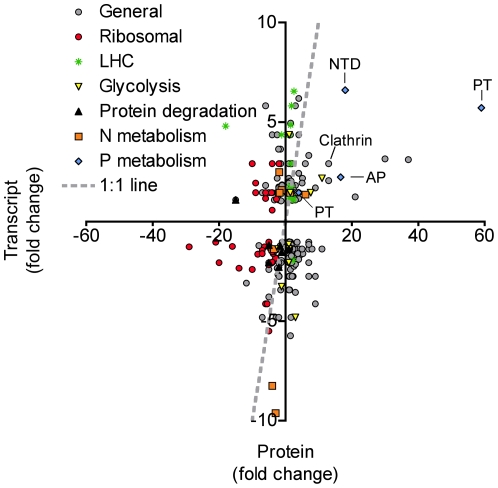
Figure 4. Protein versus transcript abundances.
Scatter plot comparing the proteome data and transcriptome data in the −P treatment. All fold-changes are calculated relative to a control. The gray dashed line represents the 1∶1 line. Data points falling on or near that line have similar regulation patterns at both the transcript and protein level. Specific protein IDs pointed out include: Clathrin, PT: Inorganic phosphate transporter, NTD: 5′-nucleotidase, and AP: Alkaline phosphatase. The sulfolipid biosynthesis protein (SQD1) was not represented in the transcriptome data.

