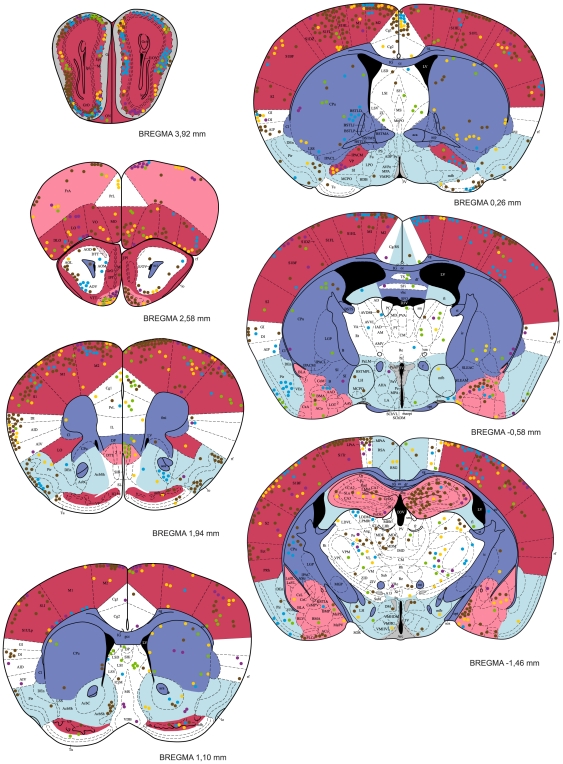
Figure 4. The distribution of T. gondii cysts in the forebrain of a mouse with latent toxoplasmosis.
Coronal diagrams compile results from five infected CD1 mice. Tissue cyst locations are indicated by color circles (each circle represents a single cyst); colors refer to the individual animals investigated. The cyst density within brain regions is classified into five classes – very high, high, medium, low, and very low, which are colored red, pink, white, blue, and dark blue, respectively. Grey indicates the dopaminergic system. The antero-posterior positions of the sections are determined by Bregma coordinates. See Abbreviations S1 for abbreviations.

