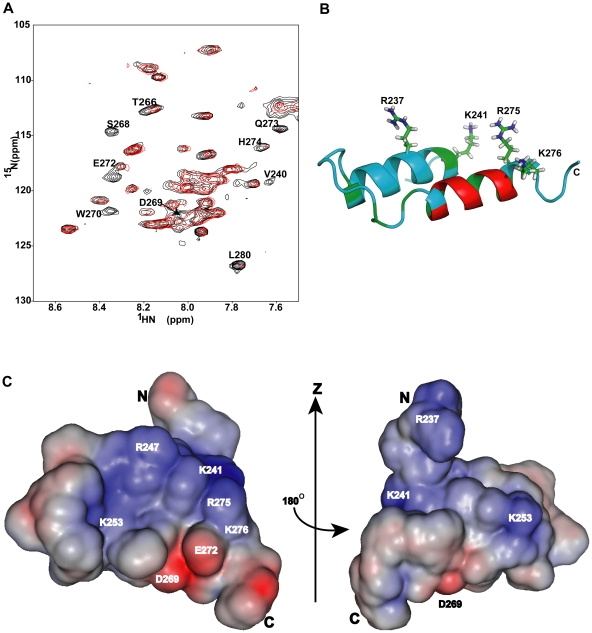
Figure 4. Paramagnetic effect on alpha45.
A. Superposition of the 1H-15N HSQC spectra of alpha45 in 1% SDS (black) and in 1% SDS with 4× excess MnCl2 (red). Amino acids that are solvent exposed and/or accessible to Mn2+ had their 1H-15N signals broadened. Those amino acids are labeled. B. Ribbon representation of alpha45 shows the location of the basic residues that were most protected from the paramagnetic effects in 1% SDS. The regions colored in green represent the amino acids that were protected from paramagnetic effect only in SDS but not in aqueous solution. The residues whose NH signals were affected by Mn2+ in both SDS and aqueous solution are shown in red and found to be located on the outer surface of helix II C. Two views of the electrostatic map of alpha45. The blue represents basic patches and red indicates acid patches. The orientation of the left image is the same as that shown in ‘B’. The map was generated by PBEQ-solver [59], [60].

