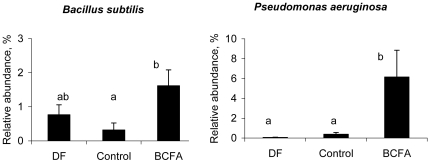
Figure 5. The relative abundance of Bacillus subtilis and Pseudomonas aeruginosa.
The relative abundance (%; mean ± SEM) of Bacillus subtilis and Pseudomonas aeruginosa differed significantly among the experimental groups. DF (n = 8); Control (n = 9); BCFA (n = 11). Means not marked by the same letter are significantly different (p<0.05).

