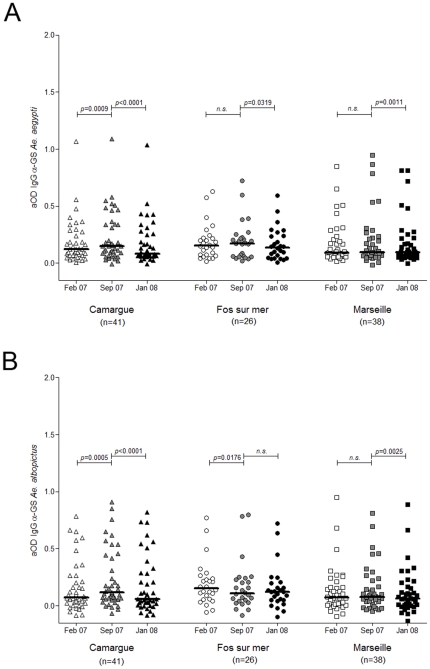
Figure 4. IgG serum levels anti-Ae. aegypti and anti-Ae. albopictus salivary gland protein extracts.
Scatter plots of IgG antibody responses against the salivary gland extracts of Ae. aegypti (A) and Ae. albopictus (B) in individuals from Marseille (squares), Fos-sur-mer (circles) and Camargue (triangles) at three time points February 07 (T1), September 07 (T2) and January 08 (T3), are represented in white, grey and black symbols, respectively. Antibody responses are represented by aOD: the mean OD value of wells with antigen minus the OD value of wells without antigen. Each point shows the aOD value for a single individual. Horizontal bars show medians. Differences between two time points at a single site were tested using the Wilcoxon signed-rank test. p-values are indicated.

