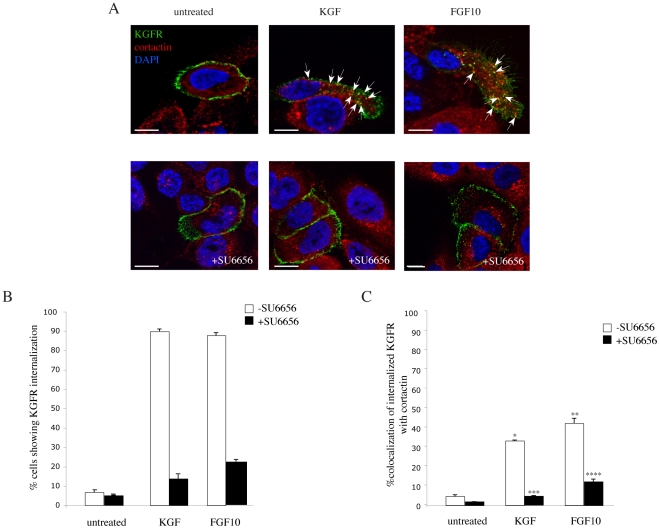
Figure 6. Src signaling is required for KGFR endocytosis.
A) HaCaT KGFR cells were incubated at 4°C with the anti-Bek polyclonal antibodies, to selectively stain the plasma membrane receptors, and then treated with KGF or FGF10 to induce receptor internalization from the plasma membrane. Double immunofluorescence analysis, using anti-cortactin monoclonal antibody, shows that in untreated cells the KGFR signal appears uniformly distributed on the cell surface, while the cortactin signal is evident in dots dispersed throughout the cytoplasm, which correspond to sorting endosomes. Virtually no colocalization is observed between the two proteins. After KGF or FGF10 stimulation, HaCaT KGFR cells show a migratory phenotype and the internalized KGFR appear in endocytic dots polarized at the leading edge of migrating cells, in which the receptor significantly colocalizes with cortactin (arrows). Treatment with SU6656 is able to block the ligand-induced KGFR internalization, and consequently its colocalization with cortactin in endocytic dots: the receptor staining is uniformly distributed on the plasma membrane, while the cortactin labeling remains dispersed throughout the cytosol, as observed in untreated cells. Images shown were obtained by 3D reconstruction of a selection of three out of the total number of the serial optical sections, as reported in figure 2. Bars: 10 µm. B) Quantitative analysis of percentage of HaCaT KGFR cells showing internalized KGFR was performed by counting 100 cells that overexpress KGFR for each condition, randomly taken from 10 microscopic fields in three different experiments, and values are expressed as the mean value ± standard errors (SE). C) Quantitative analysis of the percentage of colocalization of KGFR with cortactin was performed as described above. The percentage of colocalization was calculated analyzing a minimum of 50 cells for each treatment randomly taken from three independent experiments. Results are expressed as mean values +/- SE. Student's T test was performed and significance levels have been defined. Student's T test was performed and significance level has been defined as above. *p<0,005 vs the corresponding untreated cells; **p<0,005 vs the corresponding untreated cells; ***p<0,001 vs the corresponding cells –SU6656; ****p<0,005 vs the corresponding cells –SU6656.

