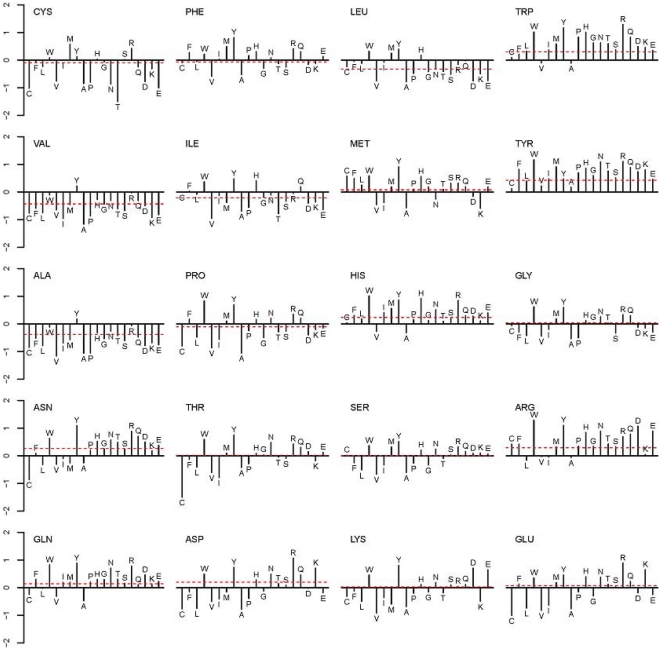
Figure 3. Sequence-based residue-pair contact propensities (natural logarithmic values) in a protein-protein interface.
Each plot corresponds to interface propensity of a residue with all of the 20 possible partner residues. Single residue propensity values for the target residue are shown by a horizontal dashed line. See Table 1 for comments and Table S1 for additional details.

