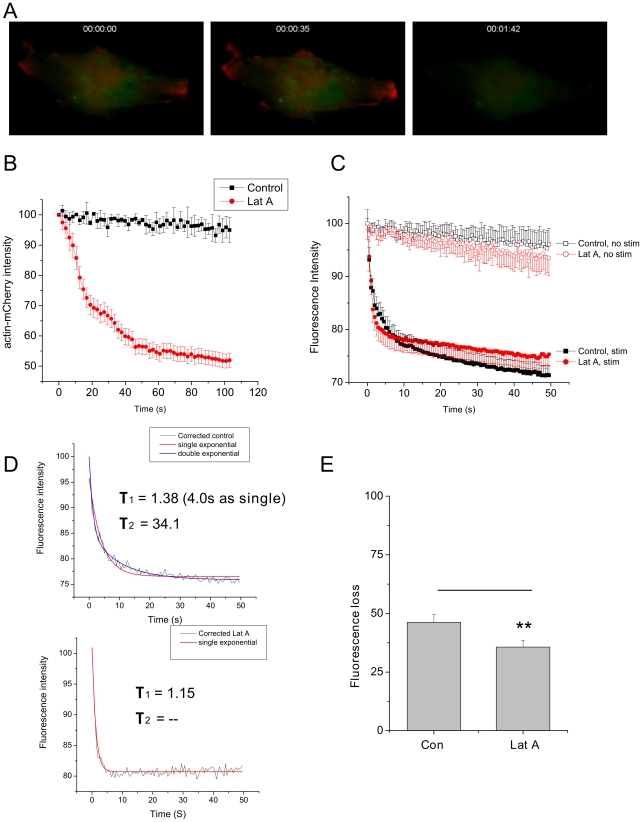
Figure 3. Effect of Latrunculin A on secretion from PC12 cells (A) PC12 cell co-expressing ANF-EmGFP and β-actin -mCherry.
Times indicated reflect time after latrunculin addition. (B) Pooled data from 8 cells, measuring fluorescence intensity within a region corresponding to the outer 25% of the cell, in the presence (red) and absence (black)of Latrunculin A. Data are mean ± sem. (C) Rate of fluorescence loss, corresponding to secretion of ANF-EmGFP, in cells with (solid symbol) and without (open symbol) stimulation. In control cells (black) showed a biphasic release curve that could be fitted to a double exponential. Treatment with latrunculin A (red) caused opposite effects on the two phases of release; speeding the initial component, and slowing the second. Data are from 12 cells, mean ± sem. (D) If unstimulated curves were subtracted from the data corrected curves can be obtained. If these are then fitted, tau values for exponential fits are as shown. Control cells do not fit well to a single exponential (red), but are well described by a double exponential (blue). Latrunculin treated cells (lower) on the other hand are well fit by a single exponential (red). Unsubtracted numbers are Con; τ1 = 2.8 s, τ2 = 38.1 s; Lat A τ1 = 2.2 s, τ2 = 168.8 s. (E) Amplitude of fluorescence loss was calculated for 8 cells which were imaged twice; once before, and again after 2 min of stimulation. Latrunculin A caused a significant reduction (p<0.01) in the amount of fluorescence loss due to stimulation.

