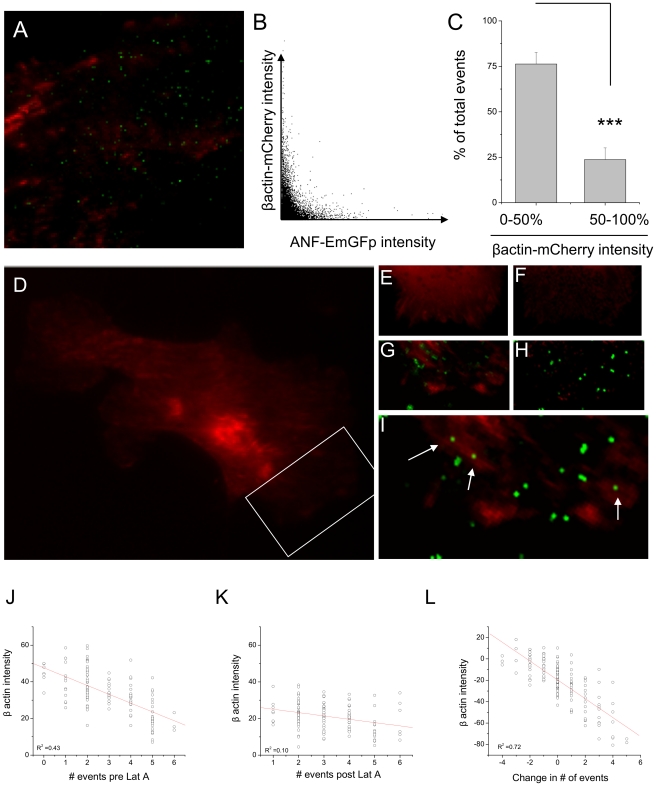
Figure 6. Separation between the actin cytoskeleton and exocytic site.
(A) TIRFM image of β-actin -mCherry (red) overlaid with a summed intensity projection of the ANF-EmGFP image series. Note that green spots, corresponding to sites of secretion, do not align with regions of actin enrichment at the membrane. (B) Plot of summed GFP intensity against mCherry intensity, illustrating the negative relationship. (C) A third method of assessing the relationship between β-actin and site of secretion is to segment β-actin images into regions above and below 50% intensity, and count the number of events within each. Data are expressed as % of total events per cell, and are the average of 6 experiments. *** indicates p<0.001. (D) TIRFM image of a cell expressing β-actin -mCherry. Box indicates region of cell highlighted in B–F. (E) Wide field image of part of cell before and (F) after treatment with latrunculin, with equal image scaling. (G) TIRFM image of β-actin with summed GFP TIRF image, before and (H) after latrunculin treatment. (I) If the pre-latrunculin β-actin image is combined with the post-treatment image of secretion (summed ANF-EmGFP), it can be seen that secretion occurs at sites that were previously unavailable. (J) Pre-latrunculin intensity of β-actin labeling within ROIs used for secretory analysis, plotted against the number of events seen within those regions, showing a negative correlation. (K) this relationship disappears after latrunculin treatment. (L) Relative change in β-actin intensity before and after latrunculin treatment is plotted against change in number of events for the same regions.

