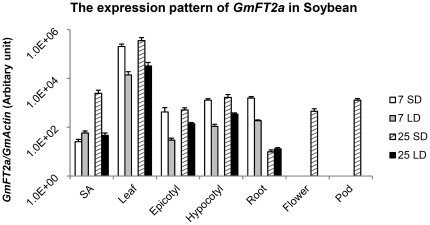
Figure 1. The expression pattern of GmFT2a in soybean.
The expression level of GmFT2a in different tissues or organs was detected by real-time quantitative PCR at 7 or 25 days after the first pair of unifoliate leaves fully expanded under short days (SD) or long days (LD). GmACTIN was used as a control gene. The data of flower and pod were not available for 7 SD, 7 LD or 25 LD, as cultivar Zigongdongdou did not flower at that time. SA, shoot apex (not including any manually removable leaves). For each real-time quantitative PCR point, the averages and standard errors are the result of three replications.

