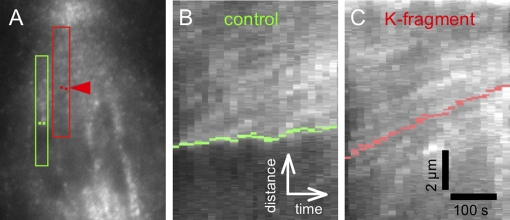
FIGURE 5:
(A) Duplicate image of Figure 4D with ROIs used for making the kymographs: ROI for kymograph presented in (B) is outlined in green; ROI for kymograph presented in (C) is outlined in red. Green dots locate the edges of the kinetochore region of the control chromosome as judged by the K-fiber attachment site imaged by DIC; red dots locate the edges of the kinetochore region of the K fragment as imaged with DIC. (B) Kymograph of speckle movement in relation to the kinetochore (green dots); green dots are moving poleward at a velocity slower than speckles and also are showing at least one speckle track emanating from the kinetochore. (C) Kymograph of red ROI in (A) showing speckle tracks having poleward velocities similar to that of the K-fragment's kinetochore (located with red dots). Vertical bar: 2 μm; horizontal bar:100 s.

