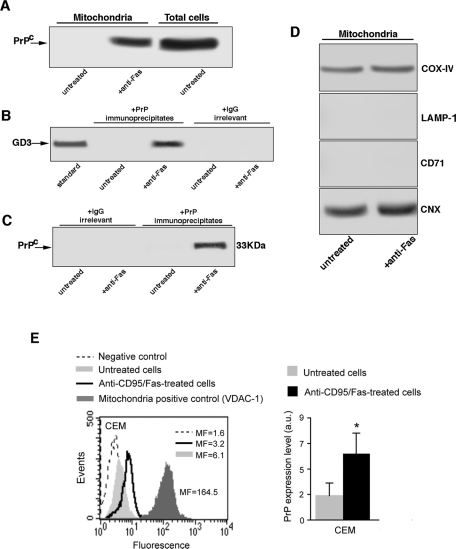
FIGURE 3:
Evidence for the presence of PrPC in crude mitochondria preparation following anti–CD95/Fas treatment. (A) Crude mitochondria preparations from CEM cells, either untreated or treated with anti–CD95/Fas, were obtained from CEM cells by standard differential centrifugation according to Zamzami et al. (2001) and analyzed by Western blot. PrPC localization was detected using an anti-PrP mAb (SAF 32). (B) Crude mitochondria preparations from CEM cells, either untreated or treated with anti–CD95/Fas, were lysed in lysis buffer, followed by immunoprecipitation with anti-PrP mAb (SAF 32). A mouse IgG isotypic control was used. The immunoprecipitates were subjected to ganglioside extraction. The extracts were run on HPTLC aluminum-backed silica gel and were analyzed for the presence of GD3, using an anti-GD3 MoAb (GMR19). (C) As a control, the immunoprecipitates were assessed by immunoblot with anti-PrP mAb (6H4). (D) The purity of the mitochondrial preparations was checked by Western blot using specific mAbs against COX-IV, LAMP-1, transferrin receptor (CD71), or calnexin. The same amounts of proteins for each sample were run. (E) Cytofluorimetric analysis of PrPC in crude mitochondria preparations. Left, results obtained in a representative experiment performed in mitochondria obtained from untreated (solid, light gray histograms) or anti-CD95/Fas–treated cells (open, black histograms). The negative control (IgG1 plus anti–mouse Alexa 488) is represented by the dashed curves. The positive control (anti–VDAC-1 plus anti–mouse Alexa 488) is represented by the solid, dark gray histogram. Numbers represent the median values of fluorescence intensity histograms. Right, mean ± SD of the results obtained from three independent experiments. Statistical analysis by Student's t test indicated a significant (p < 0.01) increase of the amount of PrPC after anti–CD95/Fas administration.

