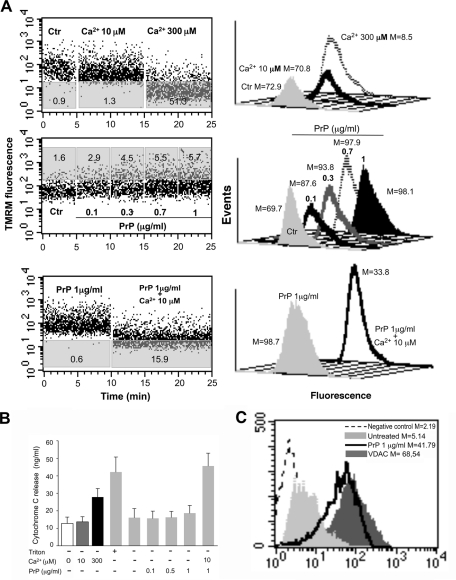
FIGURE 5:
Effect of recombinant PrP on mitochondria. (A) Swelling induction in mitochondria. Left, the swelling profile of mitochondria obtained from untreated CEM cells as monitored by means of variations in TMRM fluorescence as a function of time. Numbers in gray areas of each plot represent the percentage of mitochondria that underwent MMP increase (middle dot plot) or decrease (top and bottom dot plots). Results obtained in a representative experiment are shown. Note that 1) 300 μM calcium used as positive control induced a rapid loss of mitochondrial membrane potential, whereas calcium 10 μM was ineffective (top dot plot), 2) recombinant PrP was able to induce dose-dependent mitochondrial membrane hyperpolarization (middle dot plot), and 3) the supplement of 10 μM calcium after the PrP administration provoked a decrease of MMP in a significant percentage of cells (bottom dot plot). Right, analysis of MMP after TMRM staining of living isolated mitochondria in different experimental conditions. Numbers represent the median fluorescence values. (B) Quantitative evaluation of cytochrome c release in the supernatant of isolated mitochondria as revealed by ELISA. Note the effect of 10 μM Ca2+ in addition to recombinant PrP on the cytochrome c release. (C) Cytofluorimetric analysis of PrPC in crude mitochondria preparations. Left, results obtained in a representative experiment performed in mitochondria obtained from untreated cells (solid, light gray histograms) and rec PrP–treated cells (black histograms). The negative control (IgG1 plus anti–mouse Alexa 488) is represented by the dashed curves. The positive control (anti-VDAC-1 plus anti–mouse Alexa 488) is represented by the solid, dark gray histogram. Numbers represent the median values of fluorescence intensity histograms. Right, the mean ± SD of the results obtained from three independent experiments.

