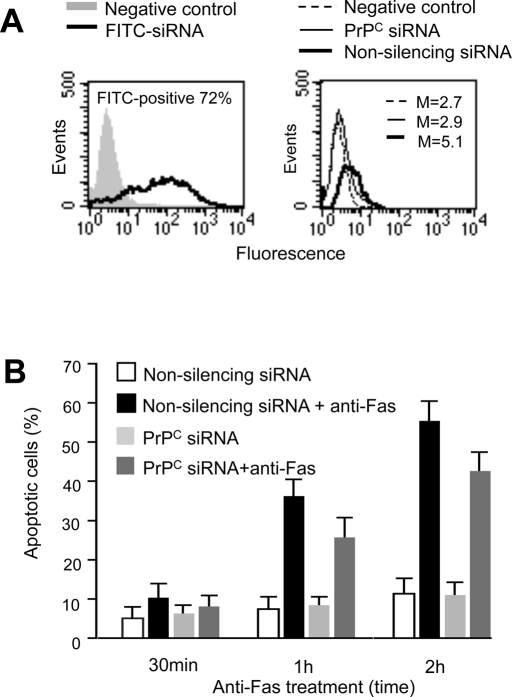
FIGURE 7:
Effect of PrPC siRNA on PrPC–tubulin association and apoptosis. (A) Left, cytofluorimetric analysis of fluorescence emission in CEM cells transfected with FITC-siRNA. The percentage of FITC-positive cells was considered indicative of the transfection efficiency. The number represents the percentage of FITC-positive cells (corresponding to transfected cells). Right, cytofluorimetric evaluation of PrPC expression 72 h after siRNA transfection. The numbers represent the median fluorescence intensity and indicate the expression level of PrPC. A representative experiment among three is shown. (B) Bar graphs showing quantitative cytofluorimetric analysis of apoptosis after cell staining with annexin V–FITC/propidium iodide. Values reported represent the percentage ± SD of positive cells obtained from three different experiments.

