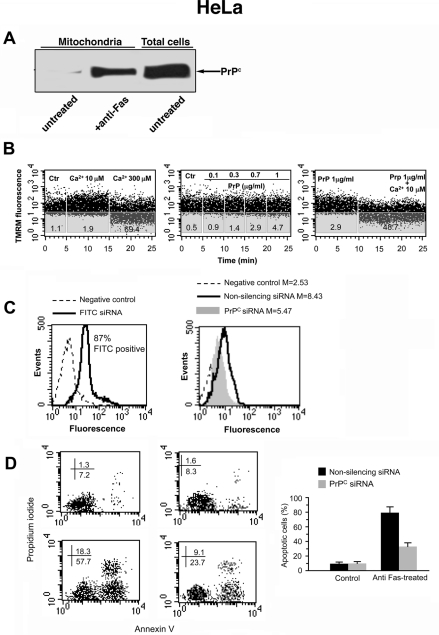
FIGURE 8:
Functional role of PrPC in HeLa cells. (A) Crude mitochondria preparations from HeLa cells either untreated or treated with anti–CD95/Fas were obtained from HeLa cells by standard differential centrifugation and analyzed by Western blot. PrPC localization was detected using an anti-PrP mAb (SAF 32). (B) Swelling induction in mitochondria. The swelling profile of mitochondria obtained from untreated HeLa cells as monitored by means of variations in TMRM fluorescence as a function of time. Results obtained in a representative experiment are shown. Note that 1) 300 μM calcium used as positive control induced a rapid loss of mitochondrial membrane potential, whereas calcium 10 μM was ineffective (left dot plot), 2) rec PrP was able to induce dose-dependent mitochondrial membrane hyperpolarization (middle dot plot), and 3) the supplement of 10 μM calcium after the PrP administration provoked a decrease of MMP in a significant percentage of cells (right dot plot). (C) Left, cytofluorimetric analysis of fluorescence emission in HeLa cells transfected with FITC-siRNA. The percentage of FITC-positive cells was considered indicative of the transfection efficiency. The number represents the percentage of FITC-positive cells (corresponding to transfected cells). Right, cytofluorimetric evaluation of PrPC expression 72 h after siRNA transfection. The numbers represent the median fluorescence intensity and indicate the expression level of PrPC. A representative experiment among three is shown. (D) Cytofluorimetric analysis of nonsilencing RNA (left) and siRNA (right) HeLa in the presence (bottom) or in the absence (top) of CD95/Fas treatment. Cell apoptosis was evaluated by staining with annexin V–FITC/propidium iodide. Values reported represent the percentage ± SD of positive cells obtained from three different experiments.

