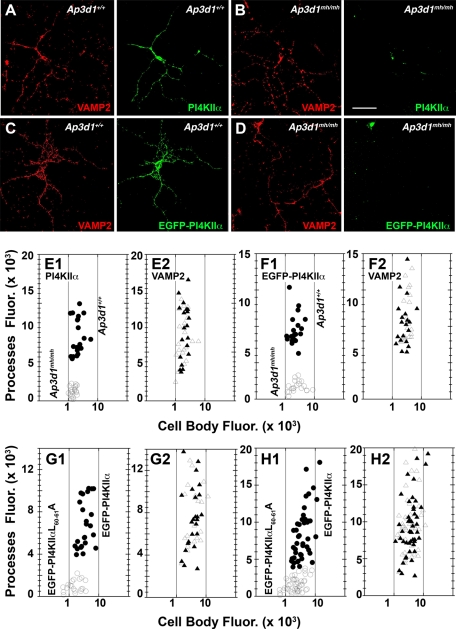
FIGURE 7:
PI4KIIα targeting to neuronal processes is impaired in AP-3–deficient mocha (Ap3d1mh/mh) neurons. Primary cultured forebrain P4 neurons from wild-type (Ap3d1+/+) (A, C) or AP-3–deficient mocha mice (Ap3d1mh/mh) (B, D) either untransfected (A, B) or transfected (C, D) with EGFP-PI4KIIα were cultured for 7DIV. Cells were stained for VAMP2 (red) and either EGFP (green) or endogenous PI4KIIα (green) and imaged by confocal fluorescence microscopy. Fluorescent pixels present in the cell body and processes were quantified for both VAMP2 and either endogenous (E) or transfected PI4KIIα (F) and presented as cell body–to–processes fluorescence intensity x, y coordinates. Closed symbols depict data from wild-type neurons, whereas open symbols depict fluorescent pixels from AP-3–null mocha neurons. Circles and triangles represent PI4KIIα and VAMP2 fluorescence values, respectively. Each point represents an individual neuron. (G, H) Primary cultured forebrain P4 neurons from wild-type mice expressing PI4KIIα or PI4KIIαL60-61A tagged with EGFP were cultured for either 7DIV (H) or 3DIV (G). Cells were stained for VAMP2 and EGFP and imaged by confocal fluorescence microscopy. Fluorescent pixels present in cell body and processes were quantified for both VAMP2 and transfected PI4KIIα (G, H). Closed symbols depict data from cells expressing wild-type PI4KIIα, whereas open symbols depict fluorescent pixels from cells expressing PI4KIIαL60-61A. Circles and triangles represent EGFP and VAMP2 fluorescence values, respectively. E1, E2, n = 20 cells; F1, F2, n = 20 wild-type and AP-3–null cells (Ap3d1mh/mh); G1, G2, n = 24 EGFP-PI4KIIα–transfected cells and n = 20 EGFP-PI4KIIαL60-61A–transfected cells; H1, H2, n = 49 EGFP-PI4KIIα–transfected and n = 45 EGFP-PI4KIIαL60-61A–transfected cells. All neurons were obtained from three independent experiments. Scale bars, 50 μm.

