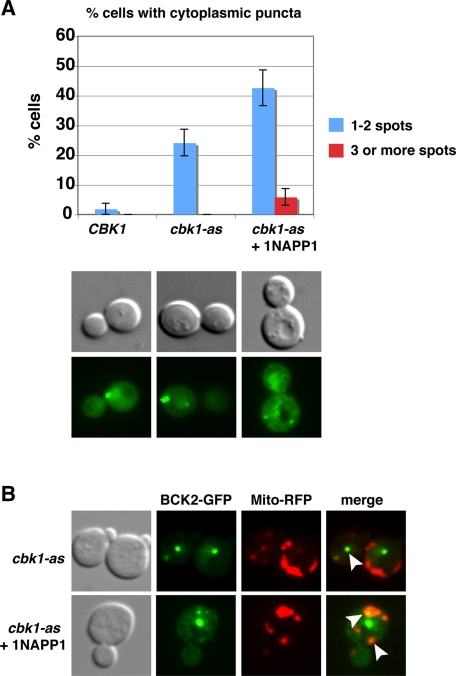
FIGURE 8:
Cbk1 inhibition enhances the appearance of Bck2 puncta. (A) cbk1-as cells expressing Bck2-GFP were monitored before and after Cbk1 inhibition. The percentages of cells with one or two cytoplasmic and three or more cytoplasmic Bck2 puncta are plotted (n = 90). Bck2 localizes to one or two cytoplasmic puncta in ∼24% of cbk1-as cells at 22°C. By 15 min of Cbk1 inhibition (1NA-PP1 addition), the number of cells with one or two Bck2 puncta nearly doubles. Cbk1 inhibition also increases the percentage of cells with three or more Bck2 puncta per cell. Representative cells are shown below the graph. (B) Many (∼49%, n = 63) of the Bck2 puncta colocalize with Mito-RFP. All images were captured via wide-field fluorescence microscopy and represent single optical sections.

