Figure 2.
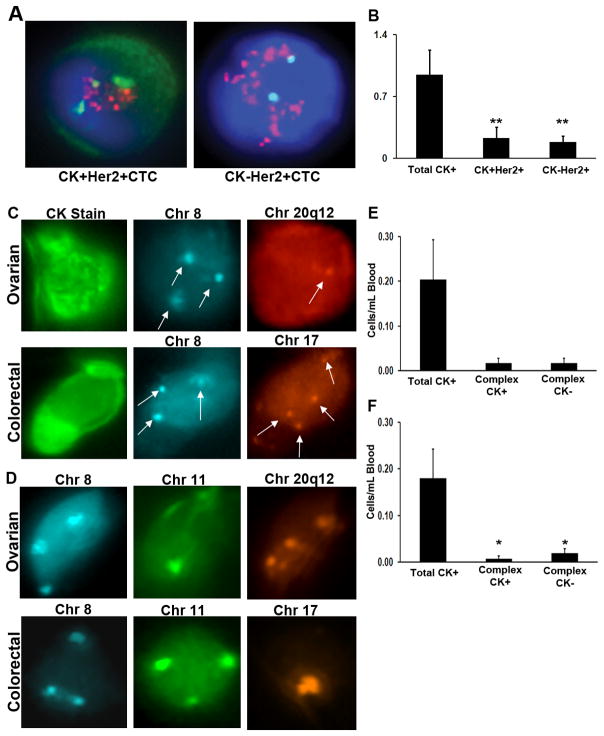
Capture of CK+ and CK− complex aneuploid CTCs in breast, ovarian or colorectal cancers. (a) Representative images illustrating detection of HER2+/CK+ and HER2+/CK− CTCs. Both cells display a >2.2 HER2/Centromere 17 ratio, confirming positive HER2 amplification. (b) Comparison of total CK+/CD45−, CK+/CD45−/HER2+ and CK−/CD45−/HER2+ cells from advanced-stage breast cancer patients. (c) Capture of circulating ovarian (top) and colorectal (bottom) carcinoma cells that stain for cytokeratin. Subsequent FISH shows an ovarian cancer cell with trisomy in chromosome 8 (blue) and monosomy in region 20q12 (red), whereas the colorectal cancer cell has trisomy in chromosome 8 and tetrasomy in chromosome 17 (orange, arrows). (d) Capture of CK-negative circulating ovarian (top) and colorectal (bottom) carcinoma cells. FISH of an ovarian cancer cell with trisomy in chromosome 8 (blue), monosomy in chromosome 11 (green), and tetrasomy in region 20q12 (orange), whereas the colorectal cancer cell has trisomy in chromosomes 8 (blue) and 11 (green) and monosomy in region 20q12. The average number of total cytokeratin, complex aneuploid cytokeratin-positive, and cytokeratin-negative circulating tumor cells per milliliter of blood is shown for (e) ovarian and (f) colorectal cancer patients. *P < 0.05, **P = 0.007.

