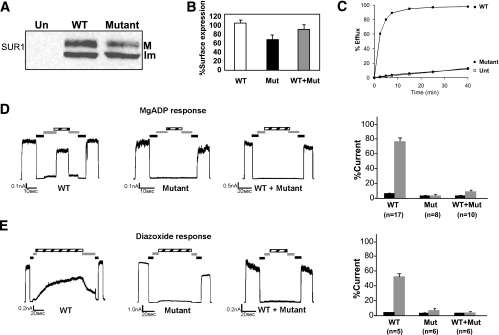
FIG. 2.
A: Representative Western blot of WT and 1508AS insertion mutant SUR1 coexpressed with Kir6.2 in COSm6 cells. M, mature complex-glycosylated band; Im, immature core-glycosylated band; Un, untransfected COSm6 cells; WT, COSm6 cells transfected with wild type; Mutant, COSm6 cells transfected with the mutant. B: Surface expression of KATP channels assessed by chemiluminescence assays. The relative chemiluminescence signal in percentage of WT, 1508AS insertion mutant (Mut), and heterozygote samples (WT+Mut) are 100 ± 3.5 (n = 6), 65.9 ± 3.5 (n = 6), and 87 ± 4.8 (n = 6), respectively. The expression levels of the mutant in both homozygous and simulated heterozygous states are lower than WT (P < 0.1). C: Channel response to metabolic inhibition assessed by 86Rb+ efflux assays. Whereas cells expressing WT channels exhibited >90% efflux, cells expressing the 1508AS insertion mutant had near background flux levels observed in untransfected (Unt) cells (<10% in 40 min). D: Representative current traces of WT and 1508AS insertion mutant channels in response to MgADP stimulation obtained by inside-out patch-clamp recording (left). In contrast to WT channels, which were activated by MgADP, the mutant and the heterozygote expressing both normal and mutant channel failed to be stimulated. Averaged response of channels to MgADP stimulation (right). The current in 0.1 mmol/L ATP (black) or 0.1 mmol/L ATP/0.5 mmol/L ADP (gray) were expressed as percentage of that observed in K-INT solution. In 0.1 mmol/L ATP/0.5 mmol/L ADP, the percent current of WT, 1508AS (μ), and WT: 1508AS (WT+μ) was 69.60 ± 4.32 (n = 17), 3.01 ± 1.96 (n = 8), and 7.37 ± 2.23 (n = 10), respectively; the values of both 1508AS and WT: 1508AS are significantly lower than that of WT (P < 0.001). E: Same as (D) except that channel response to diazoxide was examined. The percent current in 0.1 mmol/L ATP/0.3 mmol/L diazoxide for WT, 1508AS, and WT: 1508AS was 50.12 ± 4.71 (n = 5), 7.31 ± 5.28 (n = 6), and 3.03 ± 3.40 (n = 6), respectively. Again, both the simulated heterozygous and homozygous expression conditions gave significantly less response than WT (P < 0.001). (A high-quality color representation of this figure is available in the online issue.)

