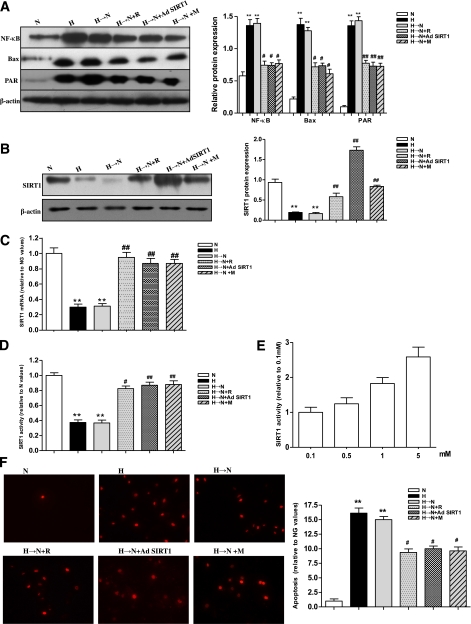
FIG. 1.
Increased NF-κB, Bax, PAR protein, and apoptosis and decreased SIRT1 in BRECs after culture in high glucose or in high glucose followed by normal glucose. A: Western blotting (left) and quantification (right) of NF-κB, Bax, and PAR protein expression profiles in cell treatment groups: normal glucose (N), high glucose (H), high glucose followed by normal glucose (H→N), H→N plus resveratrol (H→N+R), H→N plus adenovirus overexpressing SIRT1 (H→N+Ad SIRT1), and H→N plus metformin (H→N+M). B–D: Western blotting (left) and quantification (right) of SIRT1 protein (B) or real-time RT-PCR analysis of mRNA (C) expression and activity (D) profiles in the 6 groups. E: Effects of metformin (0.1, 0.5, 1.0, and 5.0 mmol/L) on SIRT1 activity in H→N. F: Analysis of cellular apoptosis levels in the 6 groups by TUNEL. Bars indicate SDs. A representative experiment of the three is shown. **P < 0.01 vs. N; #P < 0.05 vs. H→N; ##P < 0.01 vs. H→N. (A high-quality digital representation of this figure is available in the online issue.)

